Menu
Leveraged / Inverse Products
0.99%(p.a.)
4746
As of 28-03-2024
ChinaAMC NASDAQ-100 Index Daily (-1x) Inverse Product (the “Product”) is an inverse product. It is different from conventional exchange traded funds as it seeks inverse investment results relative to NASDAQ-100 Index (the “Index”) and only on a daily basis. The Product is not intended for holding longer than one day as the performance of the Product over a longer period may deviate from and be uncorrelated to the inverse performance of the Index over the period. The Product is designed to be used for short term trading or hedging purposes, and is not intended for long term investment. This product only targets sophisticated trading-oriented investors who understand the potential consequences of seeking daily inverse results and the associated risks and constantly monitor the performance of their holdings on a daily basis.
Investment involves risks, including the loss of principle. Past performance is not indicative of future results. The value of the Product can be extremely volatile and could go down substantially within a short period of time. It is possible that the entire value of your investment could be lost. Before investing in the Product, investor should refer to the Product’s prospectus and Product Key Facts Statement for details, including the risk factors. You should not make investment decision based on the information on this material alone. Please note:
• The Product aims to provide daily investment results, before fees and expenses, which closely correspond to the inverse (-1x) of the daily performance of the Index. The Product does not seek to achieve its stated investment objective over a period of time greater than one day.
• The Product is a derivative product and is not suitable for all investors. There is no guarantee of the repayment of principal. Therefore your investment in the Product may suffer substantial or total losses.
• The Product is not intended for holding longer than one day as the performance of the Product over a period longer than one day will very likely differ in amount and possibly direction from the inverse performance of the Index over that same period (e.g. the loss may be more than -1 times the increase in the Index).
• Investing in the Product is different from taking a short position. Because of rebalancing, the return profile of the Product is not the same as that of a short position. In a volatile market with frequent directional swings, the performance of the Product may deviate from a short position.
• Risk investment outcome of the Product is the opposite of conventional investment funds. If the value of the Index increases for extended periods, the Product will likely to lose most or all of its value.
• Investment in futures contracts involves specific risks such as high volatility, leverage, rollover and margin risks. There may be imperfect correlation between the value of the underlying reference assets and the futures contracts, which may prevent the Product from achieving its investment objective. The Product may be adversely affected by the cost of rolling positions forward as the futures contracts approach expiry. An extremely high degree of leverage is typical of a futures trading account. As a result, a relatively small price movement in an futures contracts may result in a proportionally high impact and substantial losses to the Product.
• The Product tracks the inverse (-1x) Daily performance of the Index. Should the value of the underlying securities of the Index increase, it could have a negative effect on the performance of the Product. Unitholders could, in certain circumstances including a bull market, face minimal or no returns, or may even suffer a complete loss, on such investments.
• There is no assurance that the Product can rebalance its portfolio on a Daily basis to achieve its investment objective. Market disruption, regulatory restrictions or extreme market volatility may adversely affect the Product’s ability to rebalance its portfolio.
• The Product is exposed to liquidity risk linked to Futures contracts. Moreover, the rebalancing activities of the Product typically take place at or around the close of trading on the NASDAQ to minimise tracking difference. As a result, the Product may be more exposed to the market conditions during a shorter interval and may be more subject to liquidity risk.
• The Product is normally rebalanced at or around the close of trading on the NASDAQ. As such, return for investors that invest for period less than a full trading day will generally be greater than or less than the inverse investment exposure to the Index, depending upon the movement of the Index from the end of one trading day until the time of purchase.
• Daily rebalancing of Product’s holdings causes a higher level of portfolio transactions than compared to the conventional exchange traded funds. High levels of transactions increase brokerage and other transaction costs.
• The Product is subject to concentration risks as a result of tracking the inverse performance of companies from the technology sector and its concentration in the US market which may be more volatile than other markets. The value of the Product may be more volatile than that of a broadly-based fund.
• The Product may be subject to tracking error risk. Tracking error may result from the investment strategy used, high portfolio turnover, liquidity of the market and fees and expenses and the correlation between the performance of the Product and the inverse (-1x) Daily performance of the Index may be reduced. There can be no assurance of exact or identical replication of the inverse performance of the Index at any time, including on an intra-day basis.
• Distributions (if any) will be made in USD. If you has no USD account, you may have to bear the fees and charges associated with the conversion of such dividend from USD to HKD or any other currency.
• The Product is passively managed and the Manager will not have the discretion to adapt to market change due to the inherent investment nature of the Product. When the Index moves in an unfavourable direction (i.e. if it increases), the Product will decrease in value.
• The daily price limit for the NASDAQ (which is triggered when the price of the S&P 500 Index drops 20% in a day) and the daily price limit for the futures contracts are different. As such, should the Index’s daily price movement be greater than the price limit of the Futures contracts, the Product may not be able to achieve its investment objective as the Futures contracts are unable to deliver a return beyond their price limit.
• As the CME may be open when Units in the Product are not priced, the value of the Futures contracts in the Product’s portfolio, or the value of constituents in the Index to which such futures contracts are linked, may change on days when investors will not be able to purchase or sell the Product’s Units. Differences in trading hours between the CME and the SEHK may increase the level of premium/discount of the Unit price to its NAV. The NASDAQ and the CME have different trading hours. Trading of the Index constituents closes earlier than trading of the Futures contracts, so there may continue to be price movements for the Futures contracts when Index constituents are not trading.
• The trading price of the Units on the SEHK is driven by market factors such as the demand and supply of the Units. Therefore, the Units may trade at a substantial premium or discount to the NAV.
| Asset Class | Futures |
| Listing Date | 28-Sep-2016 |
| Base Currency | USD |
| Net Asset Value (mil) | 3.69 |
| Manager | China Asset Management (Hong Kong) Limited |
| Domicile | Hong Kong |
| Management Fee | 0.99%(p.a.) |
| Trustee and Registrar | HSBC Institutional Trust Services (Asia) Limited |
| Distribution Policy | No regular distributions or dividends will be paid. The Manager may pay special dividends upon making an announcement in respect of the relevant distribution amount (in HKD only). |
As of 24-04-2024
| Date | Last | Change | Change(%) | |
|---|---|---|---|---|
| Official NAV per Unit in USD | 24-04-2024 | 0.3769 | -0.0011 | -0.29% |
| NAV per Unit in HKD (for reference only) | 24-04-2024 | 2.9524 | -0.0097 | -0.33% |
| Closing Price for HKD Traded Unit | 24-04-2024 | 2.9360 | -0.0640 | -2.13% |
| HKD Traded Units | |
|---|---|
| Exchange Listing | SEHK – Main Board |
| Commencement of Dealing | 28-Sep-2016 |
| Stock Code | 7331 |
| Trading Board Lot Size | 100 Units |
| Trading Currency | HKD |
| SEDOL Code | BYZTC25 |
| Reuters Code | 7331.HK |
| ISIN Code | HK0000306602 |
| Bloomberg Ticker | 7331 HK |
| Bloomberg NAV | 7331NAV |
| Bloomberg iNAV | 7331IV |
| Bloomberg Shares Outstanding | 7331SHO |
| Index | NASDAQ-100 Index |
| Index Provider | NASDAQ |
| Currency | USD |
| Closing Level | 17526.8 |
| Change | 55.33 |
| Change (%) | 0.32% |
| Type of Index | Price Return |
As of 24-04-2024
Please refer to the Hong Kong Exchanges and Clearing Limited’s website at www.hkex.com.hk for the latest lists of Market Makers.
1 Data are provided by ICE Data Indices, LLC (“ICE DATA”), is used with permission. ICE DATA, its Affiliates and their respective third party suppliers (including but not limited to Factset Research System, Inc.) disclaim any and all warranties and representations, express and/or implied, including any warranties of merchantability or fitness for a particular purpose or use, including the index data and any data included in, related to, or derived therefrom. Neither ICE DATA, its Affiliates nor their respective third party suppliers shall be subject to any damages or liability with respect to the adequacy, accuracy, timeliness or completeness of the Index data or any component thereof, and the index data and all components therefore are provided on an “as is” basis and your use is at your own risk. ICE DATA, its Affiliates and their respective third party suppliers do not sponsor, endorse, or recommend China Asset Management (Hong Kong) Limited, or any of its products or services.
2 IOPV calculations are performed by ICE DATA.
3 Intra-day Market Price refers to the market price of ChinaAMC NASDAQ-100 Index Daily (-1x) Inverse Product on the date and at the time specified above, quoted from the Stock Exchange of Hong Kong Limited (the “SEHK”).
4 The exchange rate is not a real time exchange rate and is an assumed foreign exchange rate for reference only. The assumed foreign exchange rate is Reuters 3:00 p.m. Hong Kong time mid rate quoted by Interactive Data Real-Time FX Rate for USD:HKD.
5 The Intra-day Estimated NAV per Unit in HKD is indicative and for reference purposes only. It will be updated every 15 seconds. It is calculated by ICE Data Services using the intra-day Estimated NAV per unit in USD multiplied by the real time exchange rate provided by ICE Data Services. Since the Intra-day Estimated NAV per Unit in USD will not be updated when the CME is closed, any change in the Intra-day Estimated NAV per Unit in HKD (if any) during such period is solely due to the change in the foreign exchange rate.
6 Change of the official NAV per Unit in USD and change of the NAV per Unit in HKD indicate the change of the NAV per Unit since previous Dealing Day^. Please refer to the Prospectus for more information on the determination of NAV.
7 Changes of the closing price for HKD traded Units indicate the change of the closing price since previous SEHK trading day. Source of Closing Price: Reuters.
8 The NAV per Unit in HKD is equivalent to the relevant official NAV per Unit in USD multiplied by the assumed foreign exchange rate of USD to HKD as mentioned in note 4 above as of the same Dealing Day^. The official NAV per Unit in USD and NAV per Unit in HKD will not be updated when the CME is closed.
9 Benchmark Index returns are for illustrative purposes only and are not indicative of future results. Benchmark Index returns do not reflect any management fees, transaction costs or expenses. Change indicates the change since the last closing index level. Source: NASDAQ, Bloomberg (see Terms and Conditions)
^ “Dealing Day” generally means a day on which (a) the SEHK and the underlying CME is open; and (b) the Index is compiled and published. Please refer to the Prospectus for further details in this regard.
| Class | Currency | Dealing Date | NAV per unit |
|---|---|---|---|
| USD | USD | 24-04-2024 | 0.3769 |
| HKD | HKD | 24-04-2024 | 2.9524 |
| Total Net Asset Value | Market Value of Futures Contracts | Futures Contract Exposure (b) |
|---|---|---|
| (Deemed Total Net Asset Value) (a) | ||
| 3,693,738.13 | -3,505,360.00 | -95.72% |
| (3,662,103.22) | ||
As of 24-04-2024
(a) Deemed Total Net Asset Value includes trading activities of (i) daily rebalancing; and (ii) creation and/or redemption orders of above date.
(b) Futures Contract Exposure = Market Value of Futures Contracts / Deemed Total Net Asset Value
| Name | Gross Exposure | Net Exposure |
|---|---|---|
| BNP Paribus Securities Services | -95.72% | -95.72% |
As of 24-04-2024
| Futures Contracts Name | Bloomberg Ticker | Quantity |
|---|---|---|
| NASDAQ 100 E-MINI Jun24 | NQM4 Index | -10.0000 |
As of 24-04-2024
| Holdings. | Weighting (%) |
|---|---|
| Cash and cash equivalents(USD) | 54.78 |
| CHIN SLT USD MM | 21.45 |
| UBS IRL SELECT MMKT USD-INSA MUTUAL FUND/LOAD | 14.39 |
| CHINAAMC SEL MM | 9.38 |
| Total | 100 |
As of 24-04-2024
Holdings are subject to change. Total allocation percentages shown in the Holdings table may not equal 100% due to rounding, omissions of non-stock portions, and the inclusion of the redemption payable from the stocks. The historical data provided herein is for reference only and does not represent any future performance.
As of 24-04-2024
As of 24-04-2024
| Asset Typs | Weighting(%) |
|---|---|
| #N/A | 14.39% |
As of 24-04-2024
Daily Tracking Difference (Daily TD):
Daily TD is the difference between the daily return of an Inverse Product and the daily opposite return of the underlying index.
Tracking Error (TE):
Tracking error measures how consistently an Inverse Product delivers the opposite return of the underlying index. It is the volatility (measured by standard deviation) of that daily difference.
| Actual average daily TD for calendar year 2017 | 0.01% |
| Actual average daily TD for calendar year 2018 | 0.00% |
| Actual average daily TD for calendar year 2019 | 0.00% |
| Actual average daily TD for calendar year 2020 | 0.00% |
| Actual average daily TD for calendar year 2021 | 0.01% |
| Actual average daily TD for calendar year 2022 | 0.00% |
| Actual average daily TD for calendar year 2023 | -0.03% |
| Rolling 1-year actual average daily TD# | -0.03% |
| Rolling 1-year Daily TE^ | 1.10% |
As of 28-03-2024
^TE is measured by the standard deviation of the daily TD. The standard deviation is calculated based on the daily TD over the rolling one year period.
# Rolling 1-Year TD is the rolling 1-year actual average daily tracking difference.
The Inverse Product aims to deliver the opposite of the daily return of the underlying index return. For the purposes of calculating the Daily TD, the daily performance of the underlying index has been adjusted by the leverage factor of -1x.
The Inverse Product’s performance is calculated on an NAV to NAV basis and assumes reinvestment of distribution.
| The Product | NASDAQ-100 Index | Inverse (-1x) of NASDAQ-100 Index | |
|---|---|---|---|
| 2017 | -25.95% | 31.52% | -31.52% |
| 2018 | -4.66% | -1.04% | 1.04% |
| 2019 | -28.89% | 37.96% | -37.96% |
| 2020 | -40.84% | 47.58% | -47.58% |
| 2021 | -25.47% | 26.63% | -26.63% |
| 2022 | 33.78% | -32.97% | 32.97% |
As of 31-12-2022
With effect from 8 September 2021, Rafferty Asset Management LLC ceased to be the investment adviser of the Product. The performance of the Product prior to 8 September 2021 was achieved under circumstances that no longer apply. The investment objective and strategy of the Product was also clarified on 22 March 2021.
Past performance information of the Product is not indicative of future performance. Investors may not get back the full amount invested. The computation basis of performance of Product is based on the calendar year end, NAV-To-NAV, with dividend reinvested. The graph shows how much the Product and the underlying index increased or decreased in value during the calendar year being shown. Performance of the Product has been calculated in the Product’s base currency taking into account ongoing charges and excluding your trading costs on SEHK. The Product seeks to achieve its stated investment objective in one day and rebalances at the end of the day. That is, the performance of the Leveraged Product may not correspond to two times the return of the underlying index over a one-year period or any period beyond one day and the performance of the Inverse Product may not correspond to the opposite return of the underlying index over a one-year period or any period beyond one day. Investors should refer to the Prospectus for more information about the differences between the performance of the Leveraged Product and two times the return (or opposite return for Inverse Product) of the underlying index over a period longer than one day. Where no past performance is shown there was insufficient data available in that year to provide performance.
Product launch date: 28-Sep-2016
^TE is measured by the standard deviation of the daily TD. The standard deviation is calculated based on the daily TD over the rolling one year period. # Rolling 1-Year TD is the rolling 1-year actual average daily tracking difference.
^TE is measured by the standard deviation of the daily TD. The standard deviation is calculated based on the daily TD over the rolling one year period. # Rolling 1-Year TD is the rolling 1-year actual average daily tracking difference.
| File name | Date | File Format |
|---|---|---|
| Unaudited Semi-annual Report 2023 | 21-08-2023 | PDF > |
| 2022 Annual Report | 19-04-2023 | PDF > |
| Unaudited Semi-Annual Report 2022 | 22-08-2022 | PDF > |
| 2021 Annual Report | 20-04-2022 | PDF > |
| Unaudited Semi-annual Report 2021 | 23-08-2021 | PDF > |
| 2020 Annual Report | 21-04-2021 | PDF > |
| Unaudited Semi-annual Report 2020 | 21-08-2020 | PDF > |
| 2019 Annual Report | 21-04-2020 | PDF > |
| Unaudited Semi-annual Report 2019 | 22-08-2019 | PDF > |
| 2018 Annual Report | 24-04-2019 | PDF > |
| Unaudited Semi-annual Report 2018 | 23-08-2018 | PDF > |
| 2017 Annual Report | 27-04-2018 | PDF > |
| Unaudited Semi-annual Report 2017 | 06-12-2017 | PDF > |
| File name | Date | File Format |
|---|---|---|
| Product Key Facts | 05-04-2024 | PDF > |
| ChinaAMC Leveraged/Inverse Series Prospectus | 17-04-2023 | PDF > |
Inverse Products typically aim to deliver the opposite of the daily return of the underlying index. For example, if the underlying index rises by 10 per cent on a given day, the Inverse Product should incur a 10 per cent loss on that day.
At or around the close of trading on the HKFE on each Business Day, the Product will seek to rebalance its portfolio, by decreasing inverse exposure in response to the Index’s Daily gains or increasing inverse exposure in response to the Index’s Daily losses, so that its Daily inverse exposure ratio to the Index is consistent with the Product’s investment objective.
The table below illustrates how the Product as an inverse product will rebalance its position following the movement of the Index by the end of the day.* Assuming that the initial Net Asset Value of the Product is 100 on Day 0, the Product will need to have an exposure of -100 to meet the objective of the Product. If the Index decreases by 20% during the day, the Net Asset Value of the Product would have increased to 120, making the futures exposure of the Product -80. As the Product needs a futures exposure of -120, which is -1x the Product’s Net Asset Value at closing, the Product will need to rebalance its position by an additional -40.
Day 1 illustrates the rebalancing requirements if the Index increases by 10% on the subsequent day; Day 2 illustrates the rebalancing requirements if the Index falls by 10% on the subsequent day.
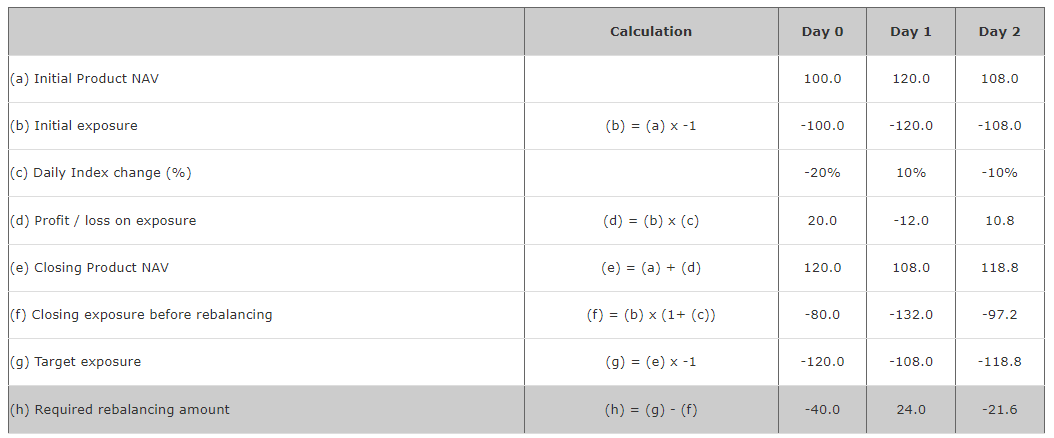
* The above figures are calculated before fees and expenses.
The Index does not include provisions for the replacement (also referred to as “rolling”) of the monthly HSI Futures as it is a standard equity index. The Manager has full discretion of futures rolling execution to meet the Product’s investment objective. The rolling of a HSI Future occurs over a 3-day period every month, starting 3 trading days before the last trading day of the spot month HSI Futures, and ending one business day before the last trading day of the spot month HSI Futures. No rolling occurs on the last trading day.
The objective of the Product is to provide inverse investment results that, before fees and expenses, closely correspond to the inverse performance of the Index on a Daily basis only. Therefore the Product should not be equated with seeking an inverse position for periods longer than a day. Investors in the Product should note that the point-to-point performance of the historical inverse performance of the Product over a certain period may not be “symmetrical” to the point-to-point performance of the Index multiplied by -100% over the same period of time due to the effect of “path dependency” and compounding of the Daily returns of the Product. The performance of the Product before deduction of fees and expenses for periods longer than a single day, especially in periods of market volatility which has a negative impact on the cumulative return of the Product, may be completely uncorrelated to the extent of change of the Index over the same period.
Investors must exercise caution when holding the Product for longer than the rebalancing interval, i.e. one Business Day. The performance of the Product, when held overnight, will likely deviate from the inverse performance of the Index.
The Product’s objective is to provide returns which are of a predetermined inverse factor (-1x) of the Daily performance of the Index. The Product rebalances its portfolio on a Daily basis, increasing exposure in response to the Index’s Daily losses and reducing exposure in response to the Index’s Daily gains. This means that for a period longer than one Business Day, the pursuit of a Daily inverse investment objective may result in Daily compounding. As such, the Product’s performance may not track -1x the cumulative Index return over a period greater than 1 Business Day. This means that the return of the Index over a period of time greater than a single day multiplied by -100% generally will not equal the Product’s performance over that same period. Over time, the cumulative percentage increase or decrease in the value of the Product’s portfolio may diverge significantly from the cumulative percentage increase or decrease in of the return of the Index due to the compounding effect of losses and gains on the returns of the Product. It is also expected that the Product will underperform the return of -100% of the Index in a trendless or flat market.
The following scenarios illustrate how the Product’s performance may deviate from that of the cumulative Index return (-1x) over a longer period of time in various market conditions. All the scenarios are based on a hypothetical HKD10 investment in the Product.
Scenario I: Continuous Upward Trend
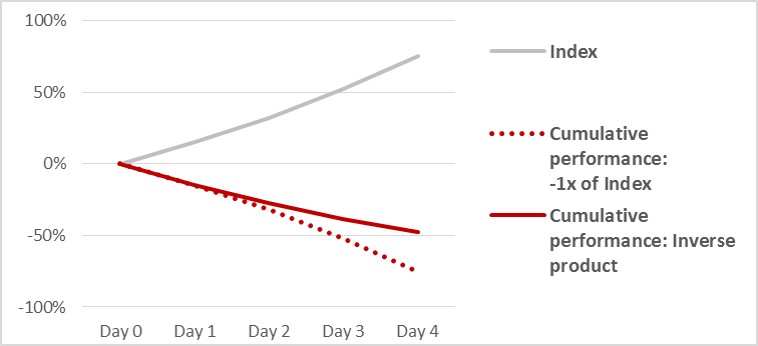
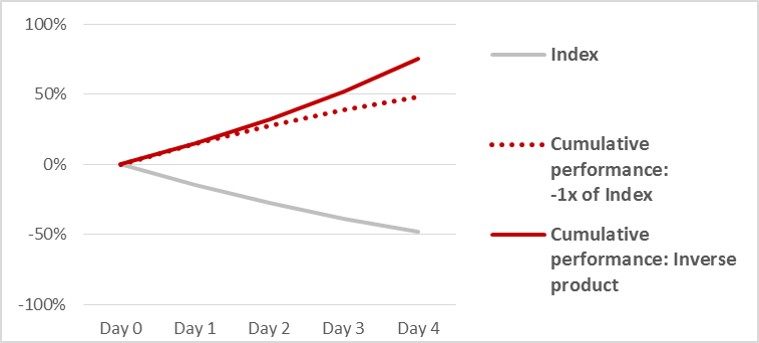
In a continuous upward trend, where the Index rises steadily for more than 1 Business Day, the Product’s accumulated loss will be less than -1x the cumulative Index gain. As illustrated in the scenario below, where an investor has invested in the Product on day 0 and the Index grows by 15% Daily for 4 Business Days, by day 4 the Product would have an accumulated loss of 47.80%, compared with a 74.90% loss which is -1x the cumulative Index return.
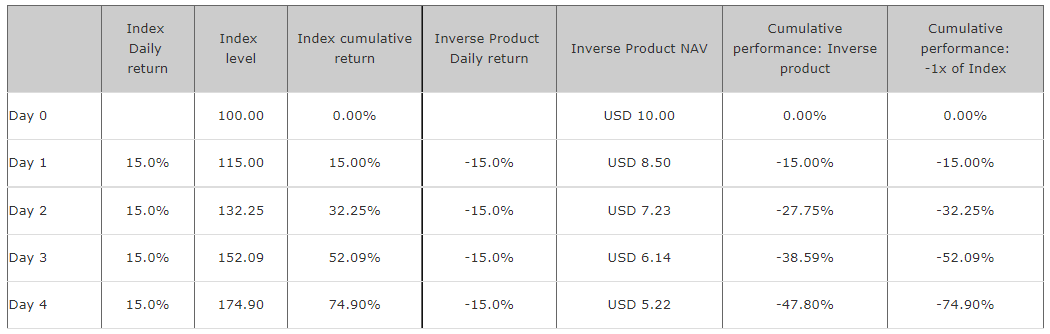
The chart below further illustrates the difference between (i) the Product’s performance; (ii) -1x the cumulative Index return; and (iii) cumulative Index return, in a continuous upward market trend over a period greater than 1 Business Day.
Scenario II: Continuous Downward Trend
In a continuous downward trend, where the Index falls steadily for more than 1 Business Day, the Product’s accumulated gains will be greater than -1x the cumulative Index return. As illustrated in the scenario below, where an investor has invested in the Product on day 0 and the Index falls by 15% Daily for 4 Business Days, by day 4 the Product would have an accumulated gain of 74.90%, compared with a 47.80% gain which is -1x the cumulative Index return.
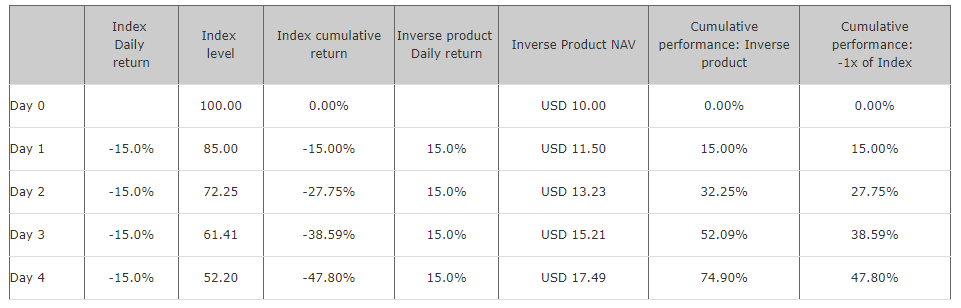
The chart below further illustrates the difference between (i) the Product’s performance; (ii) -1x the cumulative Index return; and (iii) cumulative Index return, in a continuous downward market trend over a period greater than 1 Business Day.
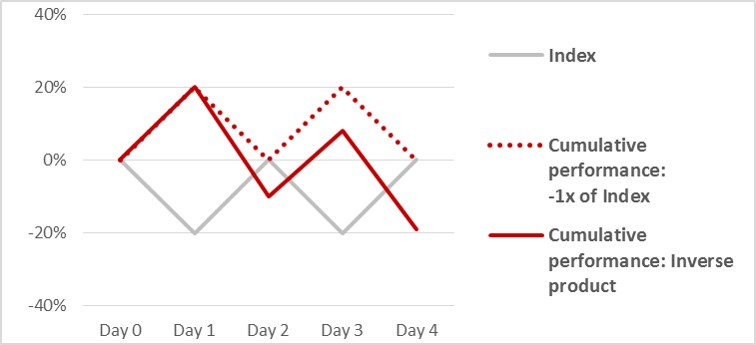
Scenario III: Volatile Upward Trend
In a volatile upward trend, where the Index generally moves upward over a period longer than 1 Business Day but with Daily volatility, the Product’s performance may be adversely affected in that the Product’s performance may fall short of -1x the cumulative Index return. As illustrated in the scenario below, where the Index grows by 12.86% over 5 Business Days but with Daily volatility, the Product would have an accumulated loss of 16.84%, compared with a 12.86% loss which is -1x the cumulative Index return.
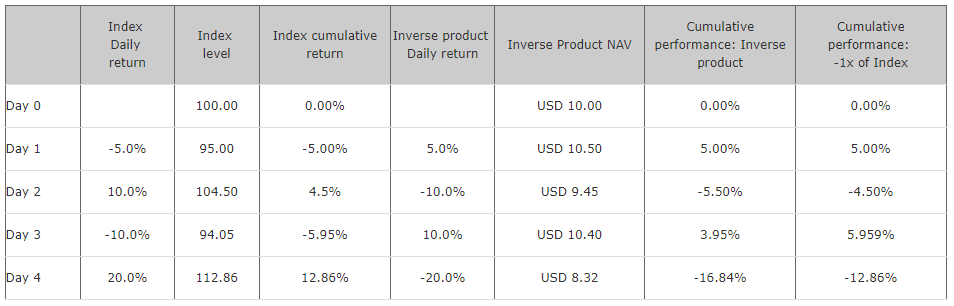
The chart below further illustrates the difference between (i) the Product’s performance; (ii) -1x the cumulative Index return; and (iii) cumulative Index return, in a volatile upward market trend over a period greater than 1 Business Day.
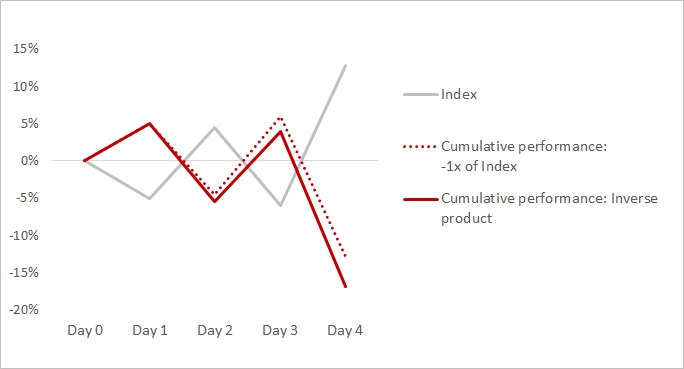
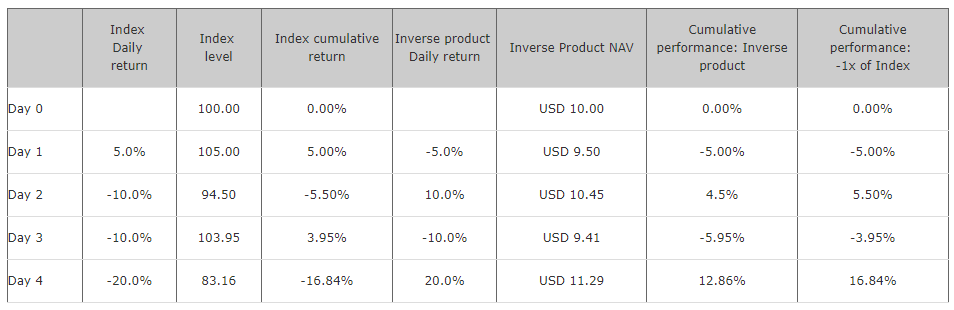
Scenario IV: Volatile Downward Trend
In a volatile downward trend, where the Index generally moves downward over a period longer than 1 Business Day but with Daily volatility, the Product’s performance may be adversely affected in that the Product’s performance may fall short of -1x the cumulative Index return. As illustrated in the scenario below, where the Index falls by 16.84% over 5 Business Days but with Daily volatility, the Product would have an accumulated gain of 12.86%, compared with a 16.84% gain which is -1x the cumulative Index return.
The chart below further illustrates the difference between (i) the Product’s performance; (ii) -1x the cumulative Index return; and (iii) cumulative Index return, in a volatile downward market trend over a period greater than 1 Business Day.
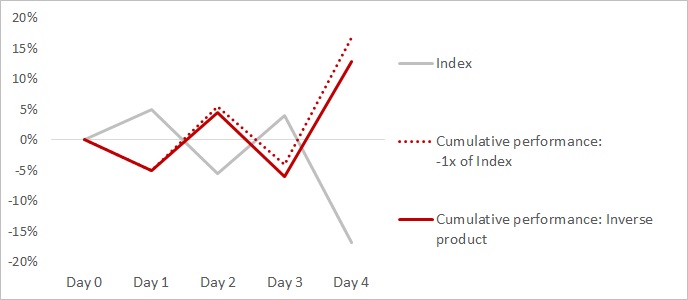
Scenario V: Volatile Market with Flat Index Performance
In a volatile market with flat index performance, the aforementioned compounding can have an adverse effect on the performance of the Product. As illustrated below, even if the Index has returned to its previous level, the Product may lose value.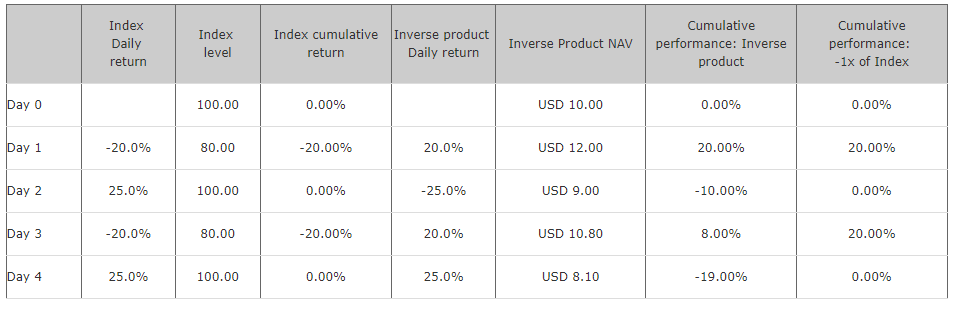
The chart below further illustrates the difference between (i) the Product’s performance; (ii) -1x the cumulative Index return; and (iii) cumulative Index return, in a volatile market with flat index performance over a period greater than 1 Business Day.
As illustrated in the graphs and the tables, the performance of the Product before deduction of fees and expenses is not “symmetrical” to the cumulative performance of the Index over a period longer than 1 Business Day.
For further illustration of the Product’s performance under different market conditions, investors may access the ‘performance simulator’ on the Product’s website at http://www.chinaamc.com.hk, which will show the Product’s historical performance data during a selected time period since the launch of the Product.
The maximum potential loss when buying leveraged and inverse Products is the entire value of the investment. However, the maximum potential loss when investors trade futures could be greater than the initial collateral posted which would result in additional margin calls.
· Investors should understand that the Inverse Product aims to provide returns closely correspond to the inverse (-1x) Daily performance of the Index. It has to rebalance its position on a daily basis in order to achieve its investment objective. As a result of rebalancing, it may not track the opposite return of the Index when it is held for less than a full trading day or overnight.
· Below is a performance simulator to allow investors to simulate the performance of the Inverse Product during the selected period based on historical data. The investor is assumed to hold the Inverse Product for the entire simulation period. The performance of the Inverse Product is calculated based on it’s NAV. The performance of the Inverse Product may not reflect the returns that the investor would be able to obtain as it does not capture the premium/ discount of the Inverse Product or the trading costs.
Please select the simulation period
Start date:
End date:
The Product
0%
NASDAQ-100 Index (Price Return)
0%
Leveraged (-1x) of NASDAQ-100 Index
0%
Product listing date: 28 September 2016. Where no past performance is shown, there was insufficient data available for that period to provide performance.
Source:China Assets Management (HK) Limitedand Bloomberg
The data presented above is for reference only and does not represent actual return.
Investing involves risk, including possible loss of principal. Investment in emerging market countries may involve heightened risks such as increased volatility and lower trading volume, and may be subject to a greater risk of loss than investment in a developed country. Please carefully consider the Fund’s investment objectives, risk factors, and charges and expenses before investing. This and other information can be found in the relevant Fund’s prospectus. Please read the prospectus carefully before investing. ChinaAMC Funds are not sponsored, endorsed, issued, sold or promoted by their index providers (only applicable to ETFs and index funds). For details of an index provider including any disclaimer, please refer to the relevant ChinaAMC Fund offering documents.
Source: Fund performance and index data are provided by ChinaAMC and the relevant index providers (if applicable) respectively.
This website is prepared by China Asset Management (Hong Kong) Limited and has not been reviewed by the Securities and Futures Commission.
Know more about ChinaAMC (HK) products:
Receive the latest information by subscribing to our e-newsletter. Please read our Privacy Policy before submitting the form.
READ THESE TERMS AND CONDITIONS (“Terms”) CAREFULLY BEFORE REGISTERING OR USING THE SERVICES DESCRIBED ON THE WEBSITE LOCATED AT www.chinaamc.com.hk. By clicking the “Accept” button, you consent to be bound by all the terms set out herein. If you do not agree with any of these terms, you are not an authorized user for these services and you should not use this website. Please click “Do not Accept” button and leave this website.
Terms and Conditions
China Asset Management (Hong Kong) Limited (“ChinaAMC HK”) is a regulated institution in Hong Kong by the Securities and Futures Commission (“SFC”) pursuant to the Securities and Futures Ordinance (Cap 571). This website is prepared and owned by ChinaAMC HK and contains information about ChinaAMC HK and the services and products offered by ChinaAMC HK. This website has not been reviewed by the SFC.
This information contained in this website is provided for informational purposes only. Funds information is intended to be made available only to residents in Hong Kong that are not U.S. Persons. If you are an individual investor, you acknowledge that you are a resident of Hong Kong. Funds information is not intended for use by any person located in or residing in any jurisdiction that restrict the use or distribution of such information. Nothing on this website should constitute a distribution, an offer to buy or the solicitation of any offer to buy or sell any securities in any jurisdiction where such a distribution or offer would be illegal. Non-Hong Kong investors are responsible for observing all applicable laws and regulations of their relevant jurisdictions before proceeding to access the information contained herein. By proceeding, you are representing that you have understood and accepted the restrictions set out in this section.
None of the information contained in this website constitute an invitation or solicitation to invest in any shares or units of the Funds, nor does it constitute any investment advice or recommendation to acquire or dispose of any investment or to engage in any transactions. Before acting on any information in this website, you should consider whether any investment, security or strategy is suitable for your particular circumstance and, if necessary, seek independent professional advice.
Investment involves risks. The price of units or shares of the Funds may go up as well as down. Past performance is not indicative of future results. The value of the Funds can be extremely volatile and could go down substantially within a short period of time. It is possible that the entire value of your investment could be lost. An investment in a Fund often involves investing in international markets. In addition to the normal risks associated with investing, international investments involve the risk of losing all or part of any capital from unfavorable fluctuations in currency values, from differences in generally accepted accounting principles or from economic or political instability in other nations. An investment in emerging markets also involves heightened other risks such as increased volatility and the possibility of lower trading volume. Funds may use or invest in financial derivatives. Please read the Funds’ Prospectuses and Product Key Fact Statements for details, including the risk factors, before making any investment decision.
Where a Fund’s investment objective is to track an index, the Fund is not sponsored, endorsed, issued, sold or promoted by the relevant index provider. None of these companies make any representation regarding the advisability of investing in the Funds. Index returns are for illustrative purposes only and do not represent actual fund performance. Index performance returns do not reflect any management fees, transaction costs or expenses. Indices are unmanaged and one cannot invest directly in an index.
Prohibited Uses
Except as otherwise stated in these Terms or as expressly authorized by ChinaAMC HK in writing, you may not:
• Use this website in any manner that could damage or overburden any ChinaAMC server, or any network connected to any ChinaAMC server, as all servers have limited capacity and are used by many people;
• Use this website in any manner that would interfere with another party’s use of the Website;
• Include the term “ChinaAMC” or any ChinaAMC trademark or executive’s name, or any variation of the foregoing, as a meta-tag, hidden textual element;
• Use any robot, spider, intelligent agent, other automatic device, or manual process to search, monitor or copy this website or the reports, data, information, content, software, products services, or other materials on, generated by or obtained from this website, whether through links or otherwise (collectively, “Materials”), without ChinaAMC HK’s permission, provided that generally available third-party web browsers may be used without such permission; or
• Use this website or the Materials in any manner that could create impression of affiliation, sponsorship or endorsement by ChinaAMC.
Limitation of Liability
All information contained in this website is published to the best of the knowledge and belief of ChinaAMC HK to be accurate at the time it was posted. However, no representation or warranty, expressed or implied is made by ChinaAMC HK as to its accuracy or completeness of the information or data provided in this website. ChinaAMC HK, its affiliates, directors, officers or employees accept no liability for any errors or omissions relating to information available in this website, and will not be liable for any damages or costs (including but not limited to lost profits, trading losses or damages that result from use or loss of use of this website) arising out of or in any way connected with (i) the use of the information provided in this website and (ii) any interruption or failure in system operation, delay in data transmission, computer virus or line or system failure.
Trademarks, Copyrights and other Intellectual Property
All copyright, trademarks and similar rights in this website and the information contained herein are owned by or licensed to ChinaAMC HK or its affiliate. Information in or any parts of this website cannot be reproduced, distributed or published.
Jurisdiction and Governing Law
These Terms shall be governed by, and shall be construed in accordance with, the laws of Hong Kong. The courts of Hong Kong shall have non-exclusive jurisdiction to hear and determine any suit, action or proceeding, and to settle any disputes, which may arise out of or in connection with these Terms and, for such purposes, you agree to submit to the jurisdiction of the courts of Hong Kong. Each party hereby waives any objection which it might at any time have to the courts of Hong Kong being nominated as the forum to hear and determine any proceedings and to settle any disputes and agrees not to claim that the courts of Hong Kong are not a convenient or appropriate forum.
Privacy Statement
We understand that our customers and website visitors are concerned about the privacy of information. The following information is designed to help you understand the information collection practices at this Website.
By visiting this Website, you are accepting the practices described in this Privacy Policy. If you do not agree to the below policy, please do not use this Website.
ChinaAMC HK recognizes the importance of personal data to our business and the importance of respecting the privacy rights of our clients. Therefore, we are committed to ensuring compliance with the requirements of the Personal Data (Privacy) Ordinance (the “Ordinance”). Each employee of ChinaAMC HK must abide by our commitment to privacy in the handling of personal information. To further enhance confidentiality and security of all personal data, only authorized staff will be allowed to have access to the personal information collected. It is restricted to those persons who have a business need to access personal information in order to perform their job duties.
The purpose of this Statement is to establish the policies and practices of ChinaAMC HK’s commitment to protect the privacy of personal data and to inform you about our responsibilities and your rights under the Ordinance.
Types of Personal Data Held
Personal data held by us regarding clients may include the following:-
• Name and address, occupation, contact details, date of birth, their identity card or passport numbers;
• Current employer, nature of position, relevant income of clients;
• Details of financial status of clients; and
• Information obtained by us in the ordinary course of the business relationship such as, investment options, account values and balances etc.
Main Purposes of keeping Personal Data
The purposes for which personal data relating to clients may be used are as follows:-
• Facilitate the daily operations of the services provided to the clients;
• Marketing investment products or services provided by ChinaAMC (HK);
• Maintaining statistical data and providing a database for product and market research;
• Marketing financial and/or investment products or services by any company/companies other than ChinaAMC HK, subject to client’s express prior written consent;
• Compliance with applicable laws and regulations; and
• Any other purposes relating or incidental thereto.
Transfer of Personal Data
Personal data held by ChinaAMC HK relating to clients will be kept confidential but may be transferred to the following parties (whether within or outside the Hong Kong Special Administrative Region) for any of the purposes stated above:-
• Any agent, contractor, third party service provider or any member company of ChinaAMC HK which provides administrative, telecommunications, computer, marketing, professional or other services to ChinaAMC HK in connection with its business operations;
• Any person to whom ChinaAMC HK is under an obligation to make disclosure under the requirements of any law binding on ChinaAMC HK or any of its member companies or under and for the purposes of any guidelines issued by regulatory or other authorities with which ChinaAMC HK or its member companies are expected to comply;
• Any actual or proposed assignee of ChinaAMC HK or participant or sub-participant or transferee of ChinaAMC HK’s rights in respect of the client; and
• Any persons or bodies corporate under a duty of confidentiality to ChinaAMC HK.
Accuracy of Personal Data
ChinaAMC HK strive at all times to ensure accuracy of all personal data collected and processed by us. In order to assist us to deliver on this pledge, please inform us immediately in the event that your personal information has been changed or you discovered that your personal information held by us is incorrect.
Your Rights
It is not a statutory requirement for you to provide personal data to us. However, we will not be able to provide you with the services and products you may require unless you provide us with the necessary personal data or information.
You have a right (i) to be informed whether we hold any of your personal data; (ii) to be supplied with a copy of your personal data we hold; and (iii) to request correction of your personal data we hold. If you wish to access to and/or to correct any of your personal data held by us, please send your written request to the address set out below. We may, subject to the Ordinance, impose a reasonable fee for complying with a data access request.
If you do not wish your personal data to be used for direct marketing purposes, you may notify us in writing to the following address:-
Head of Legal & Compliance
China Asset Management (Hong Kong) Limited
37/F, Bank of China Tower,
1 Garden Road, Central
Hong Kong
By clicking the “Accept” button, you will enter a website for other ChinaAMC(HK) products and consent to be bound by all the terms set out herein. This website is solely for the access of (i) Hong Kong Professional Investors; or (ii) non-Hong Kong investors who are eligible to access. If you are neither one of the above mentioned investor types or do not agree with any of these terms, please click “Disagree” button and leave the website.
You are leaving the Hong Kong site. You will enter a country specific website that is prepared for informational purpose only. It does not intend for and should not be accessed by persons located or resident in any jurisdiction where (by reason of that person’s nationality, domicile, residence or otherwise) the publication or availability of the website is prohibited or contrary to local law or regulation or would subject any ChinaAMC entity to any registration or licensing requirements in such jurisdictions.
None of the information contained in this website constitute an invitation or solicitation to invest in any shares or units of the funds, nor does it constitute any investment advice or recommendation to acquire or dispose of any investment or to engage in any transactions. Before acting on any information in this website, you should consider whether any investment, security or strategy is suitable for your particular circumstance and, if necessary, seek independent professional advice.
For Hong Kong investors
None of the funds mentioned in the upcoming country specific website has been authorized by the Hong Kong Securities and Futures Commission to be marketed to the general public in Hong Kong. Any information of the funds in the website is provided solely for Professional Investor and you must qualify as a Professional Investor in order to access to the website. Professional Investor is defined under Section 1 of Part 1 of Schedule 1 to the Securities and Futures Ordinance (“SFO”). If you are uncertain or have doubt on whether you qualify as a Professional Investor, please contact ChinaAMC(HK) for enquiry or consult your finance or legal advisor before proceeding.
By clicking the “Accept” button below, you consent that you qualify as a Professional Investor.
For Non-Hong Kong Investors
It is your responsibility to be aware of, to obtain all relevant regulatory approvals, licenses, verifications and/or registrations under, and to observe all applicable laws and regulations of any relevant jurisdiction in connection with your entrance to the country specific website you enter or with your access to the information contained herein.
By clicking the “Accept” button below, you consent that you have obtained all relevant regulatory approvals and have observed all applicable laws and regulations of any relevant jurisdiction before proceeding.
Investment Risks
Investment involves risks. The price of units or shares of the Funds may go up as well as down. Past performance is not indicative of future results. The value of the Funds can be extremely volatile and could go down substantially within a short period of time. It is possible that the entire value of your investment could be lost. An investment in a Fund often involves investing in international markets. In addition to the normal risks associated with investing, international investments involve the risk of losing all or part of any capital from unfavorable fluctuations in currency values, from differences in generally accepted accounting principles or from economic or political instability in other nations. An investment in emerging markets also involves heightened other risks such as increased volatility and the possibility of lower trading volume. Funds may use or invest in financial derivatives. Please read the Funds’ Prospectuses and Product Key Fact Statements for details, including the risk factors, before making any investment decision.
Prohibited Uses
Except as otherwise stated in these terms or as expressly authorized by ChinaAMC(HK) in writing, you may not:
Use this website or the Materials in any manner that could create impression of affiliation, sponsorship or endorsement by ChinaAMC(HK).
Limitation of Liability
All information contained in this website is published to the best of the knowledge and belief of ChinaAMC(HK) to be accurate at the time it was posted. However, no representation or warranty, expressed or implied is made by ChinaAMC(HK) as to its accuracy or completeness of the information or data provided in this website. ChinaAMC(HK), its affiliates, directors, officers or employees accept no liability for any errors or omissions relating to information available in this website, and will not be liable for any damages or costs (including but not limited to lost profits, trading losses or damages that result from use or loss of use of this website) arising out of or in any way connected with (i) the use of the information provided in this website; and (ii) any interruption or failure in system operation, delay in data transmission, computer virus or line or system failure.
Trademarks, Copyrights and other Intellectual Property
All copyright, trademarks and similar rights in this website and the information contained herein are owned by or licensed to ChinaAMC(HK) or its affiliate. Information in or any parts of this website cannot be reproduced, distributed or published.
Private Funds
ChinaAMC(HK) is uniquely positioned in the market which enables it to leverage its extensive knowledge, research capabilities and investment experience in China to deliver a range of high-value asset management or investment advisory services to institutional clients worldwide. To bridge overseas investors with China opportunities, ChinaAMC (HK) is committed to utilize its local expertise to capture enormous investment potentials in China.
The private fund products issued and managed by ChinaAMC (HK) include Cayman Islands registered funds and Luxembourg domiciled SICAV funds*.
Browse through our website and discover our investment strategies. For private fund products information, please visit the product page by logging into your account.
* SICAV fund is an open-ended collective investment scheme common in Western Europe and may be open to public investors in certain European countries depending on its registration status.
Lorem ipsum dolor sit amet, conse ctetuer adipi scing elitenean.